5-Measurements
Measurements were made by IRGA (LI-6400 XT Portable Photosynthesis System).
Table 1- Net Photosynthetic rate for all plant in all conditions.
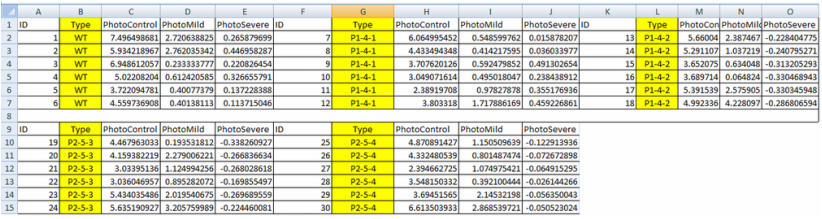
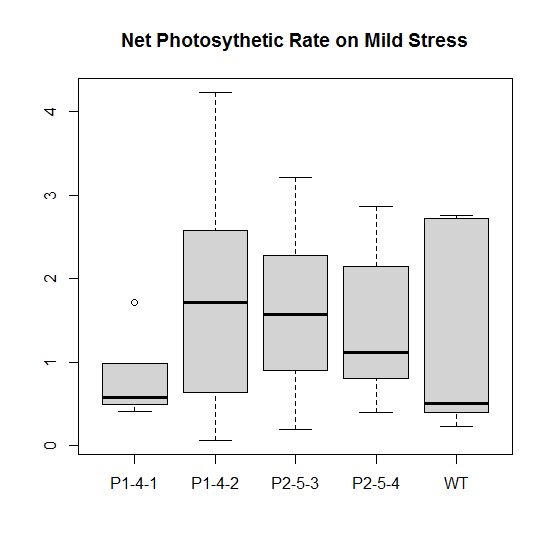
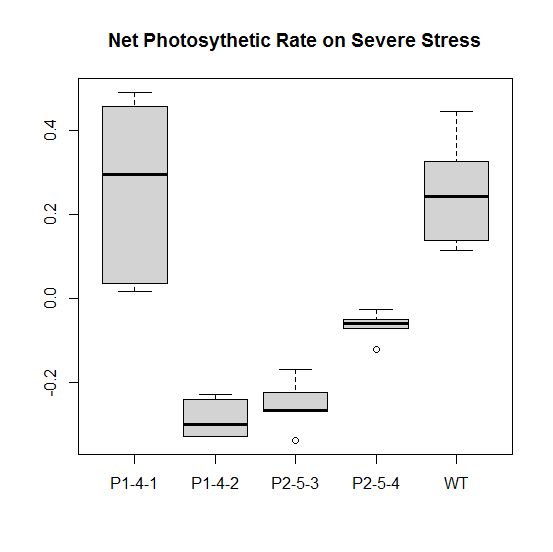
Figure 1- Net Photosynthetic rate for all plant in all conditions.
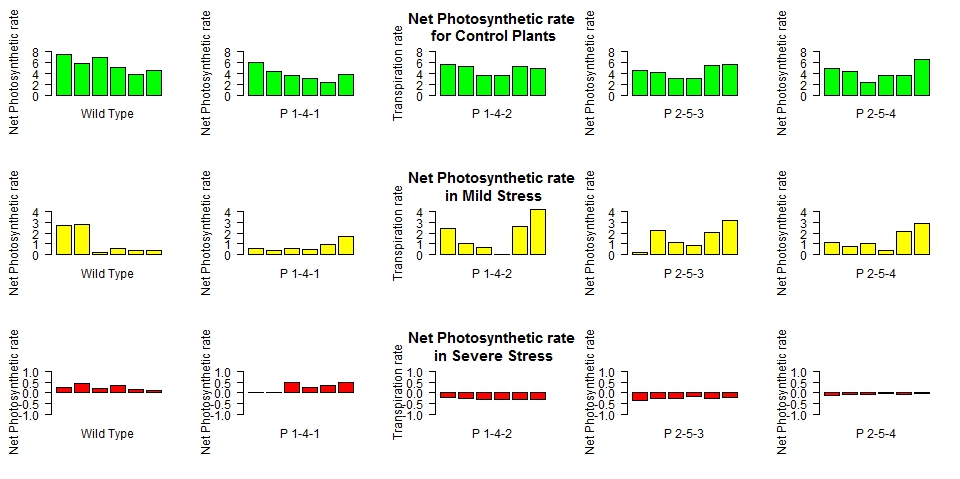
From the Photosynthesis rate we can clearly understand that, in mild stress P142,P253 and P254 have more resistance to the drought stress than other two. However, on the severe stress, Wild type and P141 have more resistance to drought.
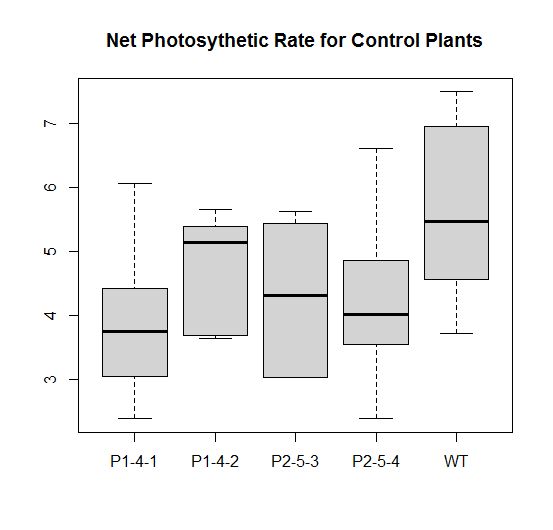
Figure 2- Comparison of the means of Photosythetic rate for all stress types.
|
|
|
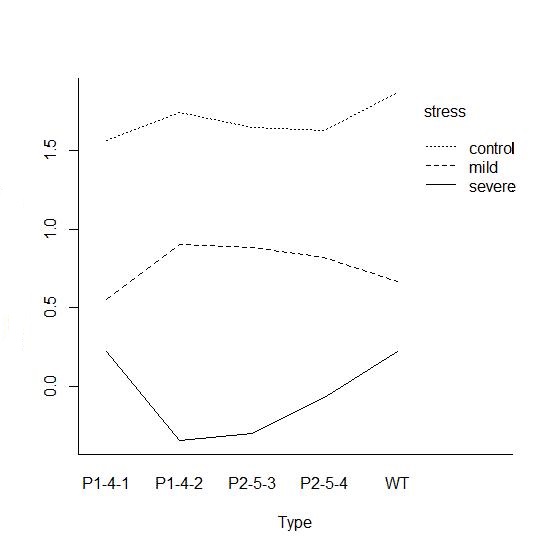
Figure 3- Interaction between plants types and stress conditions for net photosynthetic rate.
Shapiro test is applied to test data set is normally distributed or not. Unfortunately, data set is not normally distributed according to p-values obtained from Shapiro-Wilk normality test. It is decided to transform data by using log transformation. After log transformation, data was tested if its normally distributed. When data set is normally distributed, Multi- way Analysis of Variance (Anova) is performed and according to that, Ho is rejected and Ha is accepted which is there is an effect on the plants because of stress for net photosynthetic rate.
As a result, on the severe stress condition , P 1-4-1 plants have more more resistance to drought than P 1-4-2. P 2-5-3 plants have more resistance to drought than P 1-4-2. P 2-5-4 plants have more resistance to drought than P 2-5-3. Wild type plants have more resistance to drought than P 2-5-4.
On the mild stress condition, P 1-4-2 plants have more resistance to drought than P1-4-1, P 2-5-3 and wild type plants. And also, P 2-5-3 have more resistance to drought than P 1-4-1, P 2-5-4 and wild type plants. P 2-5-4 have more resistance to drought than wild type plants.
On the controlled condition without stress, P 1-4-2 have more net photosynthetic rate than P 1-4-1, P 2-5-3 and P2-5-4. And wild type plants have more net photosynthetic rate than P1-4-2.
Briefly, on the controlled condition without stress wild type plants have more net photosynthetic rate than others but on the mild stress P 1-4-2 have more net photosynthetic rate than others and on the severe stress P 1-4-1 plants have net photosynthetic rate than others. So this is just because aquaporins are altering in different stress type.
6= RNA Results from LCM
Figure 4- RNA results from LCM samples.

After physiological measurements,leaf segment were collected and processed as mentioned on methods then LCM part was performed. Results are shown above for RNA extraction.
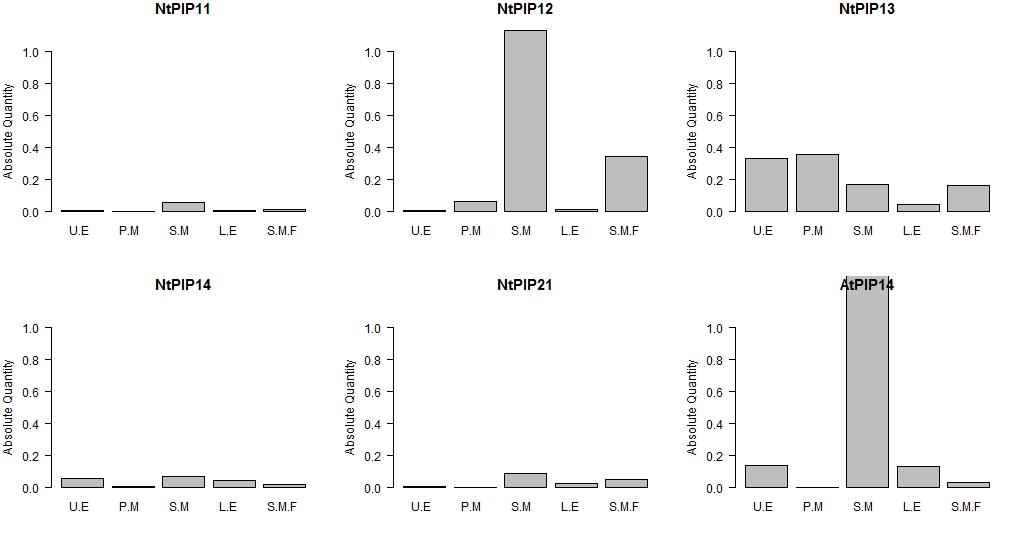
7- Aquaporin Expression on Wild Type Control Plants
When expression was checked NTPIP 1-2, NTPIP 1-3 and AtPIP 1-1 target genes were hooked on spongy mesophyll. This expression check is performed only for wild type control plants without stress so this part is still ongoing process.
When expression was checked NTPIP 1-2, NTPIP 1-3 and AtPIP 1-1 target genes were hooked on spongy mesophyll. This expression check is performed only for wild type control plants without stress so this part is still ongoing process.
Figure 5- Aquaporin expression result for Wild type plants on control condition without stress.